A quick update as we have been working on a number of projects. One is creating a simplified road network for London to explore the road structure in relation to network theory (see Masucci) but also for its use in accessibility measures. Our second project is building a detailed land use database for London (using SQL Server which we access through ArcSDE).
The purpose of the database is so our research group can use it for various applications (such as land use modelling, residential agent-based modelling, urban sprawl analysis, sustainability, rain water harvesting etc). The aim of the land use database is to tag all the buildings within London with various attributes such as use, whether it is a house, a flat or an office etc. The data sets we are using include; Ordnance Survey MasterMap and Address layer 2 , building heights via LIDAR data from InfoTerra. We are using Cities Revealed data for residential building types and age along with several other datasets. When combined it will allow for fine scale and extensive modelling of the of London’s housing market & built environment.
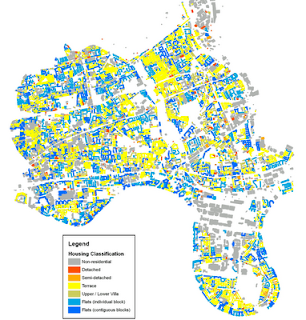
Below are some preliminary outputs, including a land use visualisation of the Isle of Dogs, the London Borough of Tower Hamlets broken down by residential property types and finally residential density within a section of the Isle of Dogs.
Isle of Dogs Land-use 3D Visualisation (Red is Residential, Dark blue is Office, Light blue is Office Mixed Use).
 Housing Classification of Tower Hamlets, London (yellow is terraced housing, blue is flats and grey is non residential).
 Residential Density within the Isle of Dogs (Dwellings per Hectare)

The combined land use data is interesting. I wonder why you use ArcSDE and SQL Server when you could learn to use some open source alternatives and then look to tap into available Grid Computers to do the data integration.
There are lots of metrics for the buildings/parts of buildings that could be useful. Size of the biggest room, volume, floor area etc… Hard to know what you can get until I take a look at the data I suppose. What about land registry data? I wonder what other property databases there are out there…
London and Edinburgh and a few other cities in the UK may have a lot going on underground depending on where ground level is determined and if that is a single thing.
Pretty pictures. Can you do the last one again as dwellings per unit volume? It would be interesting to compare that with some other census classifications.
Hi Andy,
Interesting comments. About the sub-building geometry- the concept with the database is to be as open-ended as possible in what data can be included. The initial base uses mastermap and LIDAR building heights as the geometry, so is widely available and produces basic building volume (2.5D), but is missing number of floors, rooms, floorspace etc. However using detailed address data (which we’ve matched to the geometry) you can pull in further socio-economic datasets, like land registry and other residential data for example, or Valuation Office floorspace for commercial property analysis.
There are lots of property based datasets out there. We’ve done some analysis with the land registry house prices and would be good to investigate patterns in the downturn. Unfortunately the data does not have number of bedrooms which obviously has a big influence on prices.
Regarding open source- we are interested in expanding skills in Postgres and so on, but we are also an ESRI lab and there were a few advantages going down the SDE route. There are several interfaces to SDE and it’s not limited to ESRI clients. For example we’re interested in the LandXplorer software for large scale 3D city visualisation that is compatible with SDE.
Duncan.