Twitter Maps and #ukriots

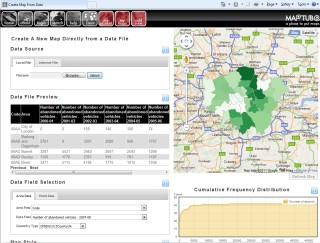
With all the media hype surrounding the use of social networking and the London riots, it left me wondering what was actually being said on Twitter in the UK. It was also a good opportunity to test out the new MapTube map creation software which can handle 35,000 clickable points on a map with ease (we tested with 500,000). So, the aim was to create a map of UK tweets which I could explore around the areas where the riots were happening to see what people were saying about them on Twitter.

In order to do this, I used the Twitter client that Steven Gray wrote to collect geocoded tweets from Twitter. This has been used for things like the real-time heatmap of London 2012 #1yeartogo tweets: http://bigdatatoolkit.org/

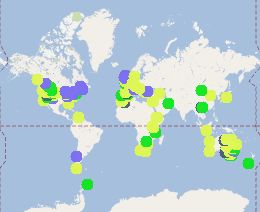
The resulting map can be seen below:

Tweets captured from Twitter between 15:00 and 22:00 on Tuesday 9th August 2011. See text for further details.

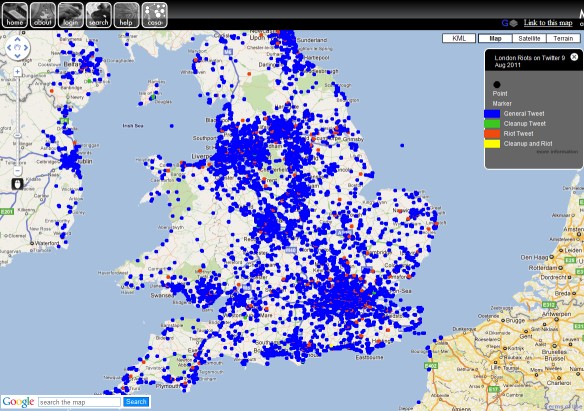
http://www.maptube.org/map.aspx?s=DHxSpVYxbLGkFyNsERbBwcCnVsChF9 (link to live map)

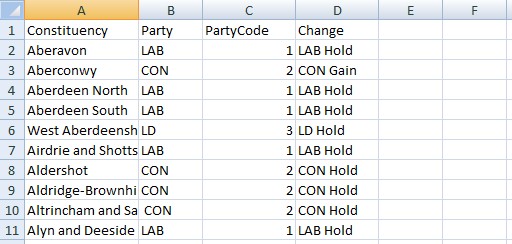
Once the data had been collected as a CSV file containing “UserId”, “Time”, “Tweet”, “lat” and “lon”, the processing was done using Excel. This will feature as a separate blog post in more detail, but I created columns of riot related hashtags and cleanup related hashtags. Then these were combined into a colour code based on whether the tweet is a general tweet (Blue), contained a riot tag (red), contained a cleanup tag (green) or both riot and cleanup tags (yellow).

There are full details in the “more information” link on the live map, but I collected 34,314 geocoded tweets in the period, of which 1,330 contained riot hashtags and 87 contained cleanup hashtags.

What’s interesting about this map is that I was expecting more tweeting about the riots. 13,330 is less than 4% of all geocoded tweets.

Where this map really comes into its own is the ability to click on messages around the riot areas and see what people are saying. I think what this highlights is that you need some sort of natural language processing as there is obviously a lot of discussion about the riots not using hash tags. People are tweeting that they or their children are scared as it sounds really close, or tweeting to people to tell them they have arrived home safely.

The other interesting thing for natural language processing researchers is that Twitter has a language all of its own. When you start reading some of the tweets it’s obvious that the contractions and slang that is being used will be a challenge to understand.

One thing I need to fix in MapTube is that it returns too much information on the popup when you click on a location. The point and click functionality returns all points covering the area of your click. If you are zoomed out a long way, then this can be hundreds of points on the speech bubble popup which causes the client browser a number of problems. I think limiting to around 20 returned points would be a safer option.

Making Maps From Wikipedia

I’ve been looking at web-based sources of geographic data and Wikipedia links are something I’ve wanted to try out for a while. I found the following page containing Worldwide fossil sites:

List of fossil sites

This gives a list of sites, but with no locations:

The “Site” column contains href links which can be followed to pages like the following:

The coordinates can just be made out in the top right hand corner of the page.

As all Wikipedia pages follow a common theme, the coodinates are embedded in a <span> tag with class=”geo”. I already had a Java program for loading a web page and converting it into xhtml, so I used this to turn the original list page into a csv file by extracting the data out of the html tables. One of the columns in this file contained the links to the site-specific pages, so another program was written to follow all these links and extract the location from the site page.

While the general technique works, only about 25% of the data had links to pages with lat/lon coordinates, so the final map is somewhat incomplete, but this can be edited manually. The map itself was built using MapTube’s new map creation system which works using the CSV file of data. The final map can be viewed at the following link:

Fossil Sites

New MapTube Map Creation Feature

We released a new feature on the MapTube website today which will make it easier to create new maps from data in CSV files. The underlying technology is used on the SurveyMapper site and for other real-time visualisations like http://bigdatatoolkit.org/2011/07/26/1yeartogo/ which shows tweets using the #1yeartogo hashtag for the London 2012 Olympics.

Creating a map of abandoned vehicles from the London Datastore using MapTube

The new update to MapTube adds a graphical user interface which allows the user to upload a data file, choose a colour scale and publish the map on MapTube directly. One of the driving forces behind this was the idea that creating a map should be simple enough that you could do it using an iPad. Data on the London Datastore  is in the correct format, so you can copy the CSV link directly from the site, which is exactly what has been done in the above image. I’ve created a YouTube clip showing the whole process, which can be viewed at the following link:

http://www.youtube.com/watch?v=naaSv7ihGOQ

This feature is still experimental, but at the m0ment it handles point data in lat/lon coordinates (WGS84) or OS coordinates for the UK (OSGB36). Point data can be drawn using markers, or as a heatmap showing point density. For area data, one column in the data is selected as a key field and this is joined with the geographic data stored in MapTube’s database to draw the map. For example, using the following data:

We have four columns: Constituency, Party, PartyCode and Change. In the CSV file the first line must be the column headings, then every subsequent line contains data. The CSV file would contain the following:

Constituency,Party,PartyCode,Change
Aberavon,LAB,1,LAB Hold
Aberconwy,CON,2,CON Gain
etc...

The “Constituency” column is the area key in this case, but MapTube determines this automatically when the CSV file is loaded, along with the type of geography, which is Parliamentary Constituencies. In order to colour the map, numeric data is required, so in this example, a column labelled “PartyCode” has been added where “LAB”=1, “”CON”=2, LD=”3” etc.

The colour scale is then chosen and the finished map submitted to MapTube where it can be viewed along with any of the other maps. There are help pages accessible through the ‘i’ icon on each section which contain further information.

As mentioned before, this feature is still experimental and we will be gradually adding more geographic data to the MapTube database to allow maps to be built from additional geographies. The aim is for MapTube to be able to automatically detect the geography just by analysing the data and, at the moment, the following geographies can be used:

Government Office Regions (UK) (GOR)
Lower level super output areas (UK) (LSOA)
Medium level super output areas (UK) (MSOA)
Output Areas (UK) (OA)
Postcode Districts (UK) (PostcodeDistricts)
County and Unitary Authority (UK) (CountyUA and ONSCountyUA)
Districts (UK) (Districts and ONSDistricts)
Census Area Wards (UK) (CASWards)
World Borders 2010 (WorldBorders2010ISO2 and ISO3 using the ISO country codes)
Parliamentary Constituencies 2010 (UK) (PCON2010)

US States and Zip code areas will be added shortly, along with adminsitrative and Census boundaries for other parts of the World.