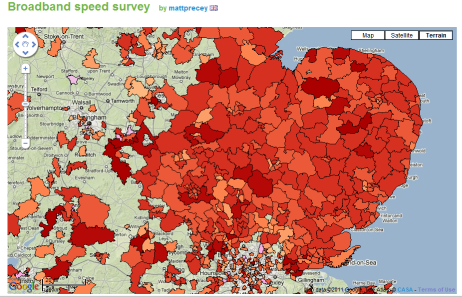
Recently, BBC Look East have been running a “Broadband Speed Survey”, asking people to use an online tester to check their broadband speed, and then enter the value, along with their postcode, into SurveyMapper. This generated 16,311 responses to the survey, but for each response people get to view the map containing the latest data, so the tile server drawing the data on the map gets about 100 times as many hits.
When the survey was advertised on the 18:30 news bulletin on the Tuesday that week, we started to get a huge number of hits in a very short space of time. The following graph shows the hits by hour of day for all five days that week.
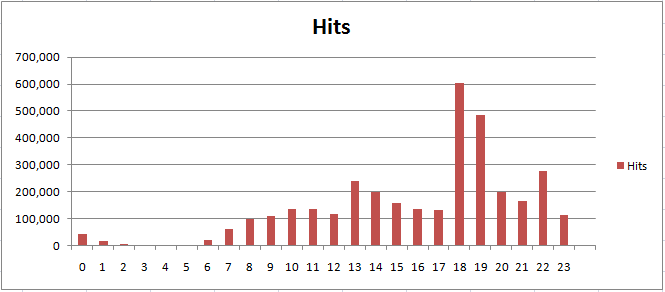
The peaks tie in quite well with the 18:30 and 22:30 news bulletins, but it can be seen from the statistics that the tile server took over a million hits in the space of a couple of hours. The tile server itself is a single machine running Server 2008 R2 Core, virtualised with two processors assigned. Once it became apparent how many hits we were getting, this was increased to 4 processors and 4GB of RAM. This shows the main benefit of virtualisation for us, which is that we could shutdown non-operational machines used purely for research and divert the computing power to the operational web servers which were taking the high loads. In order for the maps on SurveyMapper to work, we are also dependent on a database server and the dedicated web server which runs the MapTube and SurveyMapper sites, in additional to the tile server. What’s interesting about this experience is that it taught us that the database server is capable of handling a much higher load than this.
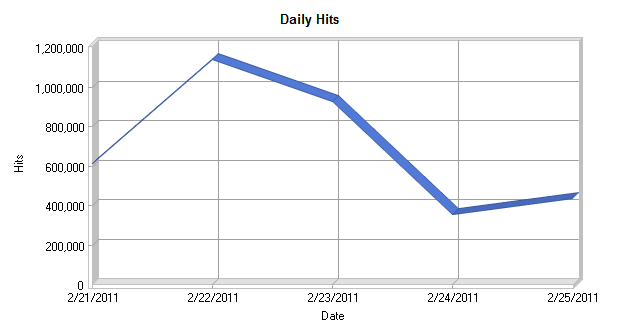
From the graph of the daily hits, it can be seen that most of the traffic was on Tuesday 22nd February, which is the first day it was advertised on the news. After this it tails off as the week progresses. One other interesting thing that was noticed when analysing the log files is the browser and operating system statistics.
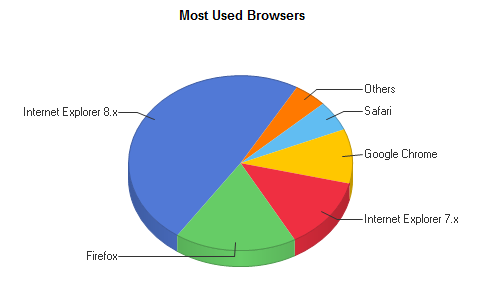
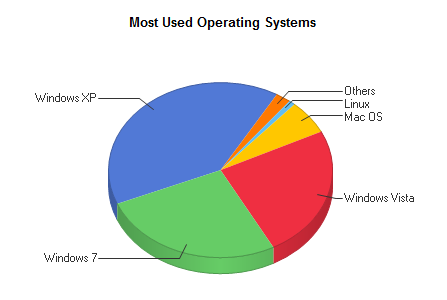
So, from these statistics, it’s a three way split between Windows XP, Vista and 7, with IE8 the most popular browser. Chrome, Firefox and Safari are lagging behind, which is surprising bearing in mind the profileration of Macs.
Now that we’ve proved a single element IIS7.5 server can take a million hits, we’re looking into the possibility of creating multiple tile servers dsitributed across two virtualisation servers and load balancing.
