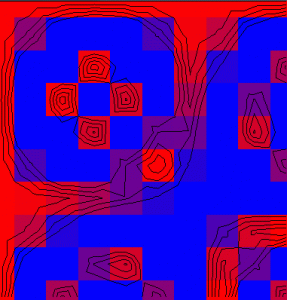
It’s been a while since I did any Fortran. I’ve been looking into contouring algorithms and decided to have a look at Paul Bourke’s Conrec program that was originally published in Byte magazine in 1987:
http://paulbourke.net/papers/conrec

The graph above shows the underlying data values as a coloured square grid with the black contour lines on top. The data point is in the centre of the grid square. Blue indicates a data value of 0.0 while red is 1.0. Contour lines are drawn for the 0.4, 0.6 and 0.8 intervals.
It is a very simple and compact algorithm, so I ended up with another C# implementation relatively quickly. There is already a C# port, along with Java, C and C++, so this was really just an aid to understanding.

Contouring algorithms can be classified into one of two types: regular grids or irregular grids. The Conrec algorithm is a regular grid contour algorithm as the data values are a 2D matrix. The x and y axes can be logarithmic or irregular, but there are data values for every point on the grid.
In contrast, irregular contouring algorithms take a list of points as input and contour from them directly. This is the situation we are in with most of our GENeSIS data, but the first step in irregular grid contouring is to understand the regular grid case. The next step is to take the point data, create a Delaunay triangulation and apply the same ideas from the regular grid case, but to the triangulation.
Having looked at regular grid contouring, the next step is an implementation of Delaunay triangulation, followed by Voronoi, which is the dual of Delaunay and can be used for adjacency calculations on polygonal areas.
