Extracting Data from PDFs: Clean Air in Schools

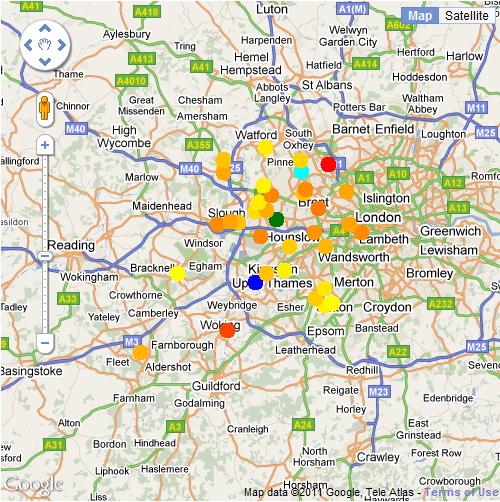
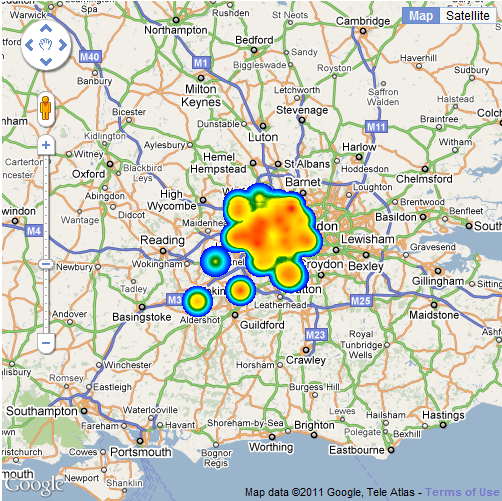
A lot of the maps I have created over the last few years have started out as tabular data in PDF documents. A recent BBC London report contained a dataset obtained from TfL of all the schools in London which are within 150 metres of a road carrying 10,000 vehicles a day or more. The report is a PDF with 21 pages, so editing this manually wasn’t an option and I decided that it was time to look into automatic extraction of tabular data from PDFs. What follows explains how I achieved this, but to start with, here is the final map of the data:

The data for the above map comes from a freedom of information request made to TfL requesting a list London schools near major roads. The request was made by the Clean Air in London group and lists all schools within 150 metres of roads carrying 10,000 vehicles a day or more. The report included a download link to the data, which is in the form of a 21 page PDF table containing the coordinates of the schools:

BBC London Article: http://www.bbc.co.uk/news/uk-england-london-13847843

Download Link to Data:  http://downloads.bbc.co.uk/london/pdf/london_schools_air_quality.pdf

The reason that PDFs are hard to handle is that there is no hard structure to the information contained in the document. The PDF language is simply a markup for placing text on a page, and so only contains information about how and where to render characters. The full PDF 1.4 specification can be found at the following link:

http://partners.adobe.com/public/developer/en/pdf/PDFReference.pdf

Extracting the data from this file manually isn’t an option, so I had a look at a library called iTextSharp (http://sourceforge.net/projects/itextsharp/), which is a port of the Java iText library into C#. The Apache PDFBox (http://pdfbox.apache.org/ ) project also looked interesting, but I went with iTextSharp for the first experiment. As the original is in Java, so are all the examples, but it’s not hard to understand how to use it. Fairly quickly, I had the following code:

[csharp]
using System;
using System.Text;
using System.IO;

using iTextSharp.text;
using iTextSharp.text.pdf;
using iTextSharp.text.pdf.parser;

namespace PDFReader
{
class Program
{
static void Main(string[] args)
{
ReadPdfFile("..\\..\\data\\london_schools_air_quality.pdf","london_schools_air_quality.csv");
}

public static void ReadPdfFile(string SrcFilename,string DestFilename)
{
using (StreamWriter writer = new StreamWriter(DestFilename,false,Encoding.UTF8))
{
PdfReader reader = new PdfReader(SrcFilename);
for (int page = 1; page {
ITextExtractionStrategy its = new iTextSharp.text.pdf.parser.SimpleTextExtractionStrategy();
//ITextExtractionStrategy its = new CSVTextExtractionStrategy();
string PageCSVText = PdfTextExtractor.GetTextFromPage(reader, page, its);
System.Diagnostics.Debug.WriteLine(PageCSVText);
writer.WriteLine(PageCSVText);
}
reader.Close();
writer.Flush();
writer.Close();
}
}
}
}
[/csharp]

This is one of the iText examples to extract all the text from a PDF and write out a plain text document. The key to extracting the data from the PDF table in the schools air quality document is to write a new class implementing the ITextExtractionStrategy interface to extract the columns and write out lines of data in CSV format.

It should be obvious from the above code that the commented out line is where I have substituted the supplied text extraction strategy class for my own one which I modified to write CSV lines:

[csharp]
ITextExtractionStrategy its = new CSVTextExtractionStrategy();
[/csharp]

The CSVTextExtractionStrategy class is defined in a separate file and is part of my “PDFReader” namespace, not “iTextSharp.text.pdf.parser”.

[csharp]
using System;
using System.Text;

using iTextSharp.text;
using iTextSharp.text.pdf;
using iTextSharp.text.pdf.parser;

namespace PDFReader
{
public class CSVTextExtractionStrategy : ITextExtractionStrategy
{
private Vector lastStart;
private Vector lastEnd;
private StringBuilder result = new StringBuilder(); //used to store the resulting string

public CSVTextExtractionStrategy()
{
}

public void BeginTextBlock()
{
}

public void EndTextBlock()
{
}

public String GetResultantText()
{
return result.ToString();
}

/**
* Captures text using a simplified algorithm for inserting hard returns and spaces
* @param renderInfo render info
*/
public void RenderText(TextRenderInfo renderInfo)
{
bool firstRender = result.Length == 0;
bool hardReturn = false;

LineSegment segment = renderInfo.GetBaseline();
Vector start = segment.GetStartPoint();
Vector end = segment.GetEndPoint();

if (!firstRender)
{
Vector x0 = start;
Vector x1 = lastStart;
Vector x2 = lastEnd;

// see http://mathworld.wolfram.com/Point-LineDistance2-Dimensional.html
float dist = (x2.Subtract(x1)).Cross((x1.Subtract(x0))).LengthSquared / x2.Subtract(x1).LengthSquared;

float sameLineThreshold = 1f; // we should probably base this on the current font metrics, but 1 pt seems to be sufficient for the time being
if (dist > sameLineThreshold)
hardReturn = true;

// Note: Technically, we should check both the start and end positions, in case the angle of the text changed without any displacement
// but this sort of thing probably doesn’t happen much in reality, so we’ll leave it alone for now
}

if (hardReturn)
{
//System.out.Println("<< Hard Return >>");
result.Append(Environment.NewLine);
}
else if (!firstRender)
{
if (result[result.Length – 1] != ‘ ‘ && renderInfo.GetText().Length > 0 && renderInfo.GetText()[0] != ‘ ‘)
{ // we only insert a blank space if the trailing character of the previous string wasn’t a space, and the leading character of the current string isn’t a space
float spacing = lastEnd.Subtract(start).Length;
if (spacing > renderInfo.GetSingleSpaceWidth() / 2f)
{
result.Append(‘,’);
//System.out.Println("Inserting implied space before ‘" + renderInfo.GetText() + "’");
}
}
}
else
{
//System.out.Println("Displaying first string of content ‘" + text + "’ :: x1 = " + x1);
}

//System.out.Println("[" + renderInfo.GetStartPoint() + "]->[" + renderInfo.GetEndPoint() + "] " + renderInfo.GetText());
//strings can be rendered in contiguous bits, so check last character for " and remove it if we need
//to stick two rendered strings together to form one string in the output
if ((!firstRender)&&(result[result.Length – 1] == ‘\"’))
{
result.Remove(result.Length – 1, 1);
result.Append(renderInfo.GetText() + "\"");
}
else
{
result.Append("\"" + renderInfo.GetText() + "\"");
}

lastStart = start;
lastEnd = end;
}

public void RenderImage(ImageRenderInfo renderInfo)
{
}
}
}
[/csharp]

As you can probably see, this file is based on “iTextSharp.text.pdf.parser.SimpleTextExtractionStrategy”, but inserts commas between blocks of text that have gaps between them. It might seem like a better idea to parse the structure of the PDF document and write out blocks of text as they are discovered, but this doesn’t work. The London schools air quality example had numerous instances where text in one of the cells (e.g. a school name, Northing or Easting) was split across two text blocks in the pdf file. The only solution is to implement a PDF renderer and extract text using its positioning on the page to separate columns.

The result of running this program on the London schools air quality PDF is a nicely formatted CSV file which took about 5 minutes to edit into a format that I could make the map from. All I had to do was remove the page number and title lines from between the pages and add a header line to label the columns. There were also a couple of mistakes in the original PDF where the easting and northing had slipped a column.

Two Line Elements

Prompted by the final space shuttle launch of Atlantis, I thought I would have another look at two line elements (TLEs). These are coded lines of data that describe the orbital dynamics of a space vehicle. The last time I looked at this was when I was working on a GPS tracking project and we wanted to predict the satellite constellation at a particular time of day, but TLEs can also be downloaded for the shuttle and International Space Station.

NASA’s J-Track shows the shuttle and ISS in near real-time:  http://spaceflight.nasa.gov/realdata/tracking/index.html

Image Copyright NASA

The TLE for the shuttle can be downloaded from the following link:

http://spaceflight.nasa.gov/realdata/sightings/SSapplications/Post/JavaSSOP/orbit/SHUTTLE/SVPOST.html

The mathematics to calculate a position from the TLE is published in the NORAD paper entitled “Spacetrack Report Number 3” (1980/1988). A later revision to this paper is also publicly available and there are various ports of the algorithm from Fortran into C, C++ and C#. While investigating this, I stumbled across a very useful library written by Michael F. Henry. It’s called “OrbitTools” and is a C++ and C# (both managed .net) implementation. His download page contains lots of other useful information and links to the spacetrack revised paper:

http://www.zeptomoby.com/satellites/

The next step was to download his C# library and write the code to load the shuttle TLE and convert the position to a location on the Earth. One point worth mentioning here is that the library calculates lat/lons in WGS72 rather than WGS84. The spheroids are slightly different, so there will be some small accuray issues, but it’s close enough for our purposes.

Having downloaded and included the OrbitTools library into a new C# project, the code to calculate the shuttle position is as follows:

[csharp]
const string TleTitle = "SHUTTLE";
const string Tle1 = "1 37736U 11031A 11190.45039996 .00020000 00000-0 20000-3 0 9019";
const string Tle2 = "2 37736 51.6412 48.9000 0077926 223.8647 135.6325 16.00701051 142";

//DateTime dt = DateTime.UtcNow;
DateTime dt = new DateTime(2011, 7, 9, 10, 40, 18, DateTimeKind.Utc);

Tle VehicleTle = new Tle(TleTitle, Tle1, Tle2);
Orbit VehicleOrbit = new Orbit(VehicleTle);
TimeSpan ts = VehicleOrbit.TPlusEpoch(dt); //how old is our TLE?
Eci VehicleEci = VehicleOrbit.GetPosition(dt); //OK, they want GMT, not UTC
CoordGeo VehicleGeoCoord = VehicleEci.ToGeo();
double lat = VehicleGeoCoord.Latitude*180.0/Math.PI;
double lon = VehicleGeoCoord.Longitude*180.0/Math.PI;
double alt = VehicleGeoCoord.Altitude;
if (lon > 180.0f) lon = -(360.0f – lon);
Console.WriteLine(TleTitle+": lat=" + lat + " lon=" + lon + " alt=" + alt);
[/csharp]

When this is run, the result written to the console is as follows (apologies for the unnecessary precision, but that’s the output I get):

lat=-25.316480642262878 lon=-60.024030447329437 alt=291.32191224312828

These values are very close to the figures on NASA’s J-Track image reproduced earlier, so we’re close to the official coordinates. When repeating this, it’s important to fix the time in the code to the same time as displayed on the J-Track applet and not just use “DateTime.UtcNow” as is commented out in the code. This is one source of inaccuracy as we’re assuming the position was calculated at zero milliseconds, which might not be the case.

References and Links

NASA J-Track: http://spaceflight.nasa.gov/realdata/tracking/index.html

OrbitTools C++/C# SGP4/SDP4 Library and other information: http://www.zeptomoby.com/satellites/

TLE Data for STS 135: http://spaceflight.nasa.gov/realdata/sightings/SSapplications/Post/JavaSSOP/orbit/SHUTTLE/SVPOST.html

Original Spacetrack Report Number 3 (1980): http://www.celestrak.com/NORAD/documentation/spacetrk.pdf

Spacetrack Report Number 3 Revisited: http://www.celestrak.com/publications/AIAA/2006-6753/

Other sources of TLE data: http://celestrak.com/NORAD/elements/

Contouring Data

It’s been a while since I did any Fortran. I’ve been looking into contouring algorithms and decided to have a look at Paul Bourke’s Conrec program that was originally published in Byte magazine in 1987:

http://paulbourke.net/papers/conrec

Simple Contours

The graph above shows the underlying data values as a coloured square grid with the black contour lines on top. The data point is in the centre of the grid square. Blue indicates a data value of 0.0 while red is 1.0. Contour lines are drawn for the 0.4, 0.6 and 0.8 intervals.

It is a very simple and compact algorithm, so I ended up with another C# implementation relatively quickly. There is already a C# port, along with Java, C and C++, so this was really just an aid to understanding.

Complex Contours

Contouring algorithms can be classified into one of two types: regular grids or irregular grids. The Conrec algorithm is a regular grid contour algorithm as the data values are a 2D matrix. The x and y axes can be logarithmic or irregular, but there are data values for every point on the grid.

In contrast, irregular contouring algorithms take a list of points as input and contour from them directly. This is the situation we are in with most of our GENeSIS data, but the first step in irregular grid contouring is to understand the regular grid case. The next step is to take the point data, create a Delaunay triangulation and apply the same ideas from the regular grid case, but to the triangulation.

Having looked at regular grid contouring, the next step is an implementation of Delaunay triangulation, followed by Voronoi, which is the dual of Delaunay and can be used for adjacency calculations on polygonal areas.

GMapCreator and Google API v3

I’ve created a new html template for the GMapCreator that uses Google’s API v3. In addition to not requiring the API key which is locked to the URL, this also means that you can take advantage of Google’s new styled maps base layers and Fusion table overlays.

The following map shows UK geology as the green overlay with a styled base layer called ‘Moody’:

The green data overlay shows UK geology from GMapCreator tiles while the base layer is using the 'Moody' style

Thanks to Steven Gray for the Moody style: http://bigdatatoolkit.org/

The GMapCreator template for creating Google API v3 maps can be downloaded from the following link: http://www.maptube.org/downloads/html-templates/template-APIv3.html 

(you need to right click and ‘save as’, otherwise it will open in the browser).

Select this as the html template in the GMapCreator and it will create Google API v3 maps from shapefiles automatically. I’ll post some alternative base map styles once I’ve had a chance to experiment with it some more.

Using the GMapCreator with 64 Bit Java

Using the GMapCreator on a 64 bit laptop recently, I found myself without access to a 32 bit Java Virtual Machine. As the Windows native version of the Java Advanced Imaging (JAI) project that the GMapCreator depends on is 32 bit only, I needed to use the pure Java version of JAI. It’s not immediately obvious how to do this, so I’ve detailed the method as follows:

1. Download and unpack the pure Java version of JAI 1.1.3. As the JAI project web page has recently changed, I’ve put a link to this on the MapTube website. You can download the JAI package from the following link: http://www.maptube.org/downloads/JAI/jai-1_1_3-lib.zip

2. Extract the files ‘jai_codec.jar’ and ‘jai_core.jar’ from the ‘lib’ directory and place them in the same folder as the gmapcreator.jar file e.g. C:\Program Files\CASA-UCL\GMapCreator if you are using the default installation folder on Windows.

3. Create a file called ‘run-gmc.bat’ in the same directory as GMapCreator.jar containing the following line:

[csharp]java -Xms1024M -Xmx1024M -classpath jai_core.jar;jai_codec.jar;gmapcreator.jar gmapcreator.GMapCreatorApp[/csharp]

4. Run the GMapCreator by double clicking on the ‘run-gmc.bat’ file.

The same technique can be adapted to work on Linux or Mac. The main advantage of using a 64 bit JVM is that you now have access to a 64 bit address space, so the GMapCreator isn’t limited by the 3GB limit in 32 bit any more.

Weather Underground

I’ve been looking at the Weather Underground API (http://wiki.wunderground.com/index.php/API_-_XML) which gives access to the observation stations and the data they are collecting.

All the stations returned from the Weather Underground XML API when using "London" as the search string. Colour indicates air temperature with blue=12.7C, green=13.9C and red=20.5C

The API uses simple commands to query for a list of stations, for example:

http://api.wunderground.com/auto/wui/geo/GeoLookupXML/index.xml?query=london,united+kingdom

Using C# and .net, this is accomplished as follows:
[csharp] WebRequest request = WebRequest.Create(string.Format(GeoLookupXML, @"london,united+kingdom"));
HttpWebResponse response = (HttpWebResponse)request.GetResponse();
XmlDocument doc = new XmlDocument();
doc.Load(response.GetResponseStream());[/csharp]
Then the returned XML document is parsed using XQuery to extract the station name, lat/lon coordinates and whether it is an ICAO station or a personal weather station.
[csharp]XmlNodeList Stations = doc.GetElementsByTagName("station");
foreach (XmlNode Station in Stations)
{
XmlNode IdNode = Station.SelectSingleNode("id");
XmlNode ICAONode = Station.SelectSingleNode("icao");
}[/csharp]
This gets us a list of stations ids and ICAOs which can then be used to build individual queries to obtain real time data from every station:
[csharp]foreach (string Id in PWSStations)
{
XmlDocument ob = GetCurrentPWSOb(Id);
XmlNode Ntime = ob.SelectSingleNode(@"current_observation/observation_time_rfc822");
XmlNode Nlat = ob.SelectSingleNode(@"current_observation/location/latitude");
XmlNode Nlon = ob.SelectSingleNode(@"current_observation/location/longitude");
XmlNode NairtempC = ob.SelectSingleNode(@"current_observation/temp_c");
string time = Ntime.FirstChild.Value;
string airtempC = NairtempC.FirstChild.Value;
string lat = Nlat.FirstChild.Value;
string lon = Nlon.FirstChild.Value;

//do something with the data…
}

//NOTE: only slight difference in xml format between PWS and ICAO
foreach (string ICAO in ICAOStations)
{
XmlDocument ob = GetCurrentICAO(ICAO);
XmlNode Ntime = ob.SelectSingleNode(@"current_observation/observation_time_rfc822");
XmlNode Nlat = ob.SelectSingleNode(@"current_observation/observation_location/latitude");
XmlNode Nlon = ob.SelectSingleNode(@"current_observation/observation_location/longitude");
XmlNode NairtempC = ob.SelectSingleNode(@"current_observation/temp_c");
string time = Ntime.FirstChild.Value;
string airtempC = NairtempC.FirstChild.Value;
string lat = Nlat.FirstChild.Value;
string lon = Nlon.FirstChild.Value;

//do something with the data…

}[/csharp]
After that it’s simply a matter of writing all the data to a CSV file so that you can do something with it.

Air temperature for London plotted using the MapTubeD heatmap tile renderer

A Week in the Life of a Tile Server

Recently, BBC Look East have been running a “Broadband Speed Survey”, asking people to use an online tester to check their broadband speed, and then enter the value, along with their postcode, into SurveyMapper. This generated 16,311 responses to the survey, but for each response people get to view the map containing the latest data, so the tile server drawing the data on the map gets about 100 times as many hits.

When the survey was advertised on the 18:30 news bulletin on the Tuesday that week, we started to get a huge number of hits in a very short space of time. The following graph shows the hits by hour of day for all five days that week.

The peaks tie in quite well with the 18:30 and 22:30 news bulletins, but it can be seen from the statistics that the tile server took over a million hits in the space of a couple of hours. The tile server itself is a single machine running Server 2008 R2 Core, virtualised with two processors assigned. Once it became apparent how many hits we were getting, this was increased to 4 processors and 4GB of RAM. This shows the main benefit of virtualisation for us, which is that we could shutdown non-operational machines used purely for research and divert the computing power to the operational web servers which were taking the high loads. In order for the maps on SurveyMapper to work, we are also dependent on a database server and the dedicated web server which runs the MapTube and SurveyMapper sites, in additional to the tile server. What’s interesting about this experience is that it taught us that the database server is capable of handling a much higher load than this.

From the graph of the daily hits, it can be seen that most of the traffic was on Tuesday 22nd February, which is the first day it was advertised on the news. After this it tails off as the week progresses. One other interesting thing that was noticed when analysing the log files is the browser and operating system statistics.

Browsers used to access SurveyMapper


Operating Systems
Operating Systems

So, from these statistics, it’s a three way split between Windows XP, Vista and 7, with IE8 the most popular browser. Chrome, Firefox and Safari are lagging behind, which is surprising bearing in mind the profileration of Macs.

Now that we’ve proved a single element IIS7.5 server can take a million hits, we’re looking into the possibility of creating multiple tile servers dsitributed across two virtualisation servers and load balancing.

MapTube Clickable Maps

We’ve just updated the MapTube website with a new release of the software that makes all of the Census maps clickable. Anything tagged with the “CENSUS2001″ keyword is clickable, as well as most of the maps made from the data on the London DataStore.

PointAndClick.jpg

The new clickable map icon. This is used to turn the clickable maps feature on or off.


MapTubePopupWindow.jpg

The resulting popup window showing attribute data for the feature that has been clicked.

The maps page now contains an additional button below the zoom level slider which shows a representation of a mouse. If this is enabled, as shown below, then a single mouse click on the map will display a popup window containing more information about the feature just as in a traditional GIS.

The image on the right shows the default popup window which just lists the attributes from the CSV file used to make the map. If you want to examine the data, there is a link to download the CSV file from the ‘more information’ page.

The html in the popup window is obtained by applying a transformation to the attribute data that turns it into the html that you see displayed in the window. In the next release of MapTube we will include a user interface to allow people to build maps of fixed geometry data (i.e. census data, ward codes, districts, countries etc) directly from data in a CSV file. We are also planning to add a web based interface to allow people to write what appears in the popup window themselves so that it will be possible to include graphs and charts.

Election 2010: Where Were All the Votes?

Using the General Election 2010 results spreadsheet from the Guardian Data Blog, we’ve produced three MapTube maps showing the distribution of votes for the three main parties:

Conservate share of vote Labour share of vote Liberal Democrat share of vote

The maps can be viewed on MapTube at the following link:

http://www.maptube.org/election/map.aspx?s=DGxUpxGSnLKhUzLIOMHBwKeUwKZUyEDAwcCnksCjlMhBwMHAp5LAoTbd

Use the red slider buttons to fade the distributions for the three parties up and down.

All our election related maps can be found at the following link:

http://www.maptube.org/election/

The UK Election results from the Guardian Data Blog can be found here:

http://www.guardian.co.uk/news/datablog/2010/may/08/general-election-2010-results-maps#data

UK General Election 2010: Results

With 649 of the 650 parliamentary seats from the 6th May 2010 General Election now declared, we can see how the policital map of the UK has changed. The one remaining seat is Thirsk and Malton where the death of one of the candidates means that the vote has been postponed until 25th May. 

Election 2010 ResultPolitical Party Colours

This map has been uploaded to our MapTube website so that the results can be compared with some of our other maps.

Here are some interesting comparisons:

Compare the 2005 election to the 2010 election results:

http://www.maptube.org/election/map.aspx?s=DGxUoiNcsKkGNyyDLBwcCnOMChZsgZwcHApzPApTnd

The 2010 result is shown on the top layer, so move the red slider left and right to see how the political outlook has changed between 2005 and 2010. Apologies for the change in the SNP colour between the two colour scales, but I will upload a new one with standardised colours later. Also, Northern Ireland is missing as we don’t have a boundary dataset for this country, but we are currently trying to obtain one.

Did the MPs’ expenses scandal cause existing MPs to lose their seats?

http://www.maptube.org/election/map.aspx?s=DGxUoiNcsKkGNyyBPAwMCnOcCidsgywcHApzfAoWbd

The top layer shows the parliamentary constituencies where MPs have been told to pay back expenses according to the Sir Thomas Legg report. Slide the top layer slider left and right to see where the parties have changed. This only shows the party colours and not how much MPs were asked to pay back. The result is actually rather inconclusive. Where there are changes, it’s possibly as much a result of boundary changes as expenses repayments. What is required is a comparison that takes both the boundary changes and repayment amounts into account.

Once the final election analysis is available we will add a 2010 turnout map and proportional representation maps of the main parties showing what percentage of the electorate voted for each party by constituency.